INFOGRAPHICS · 2026
Infographics
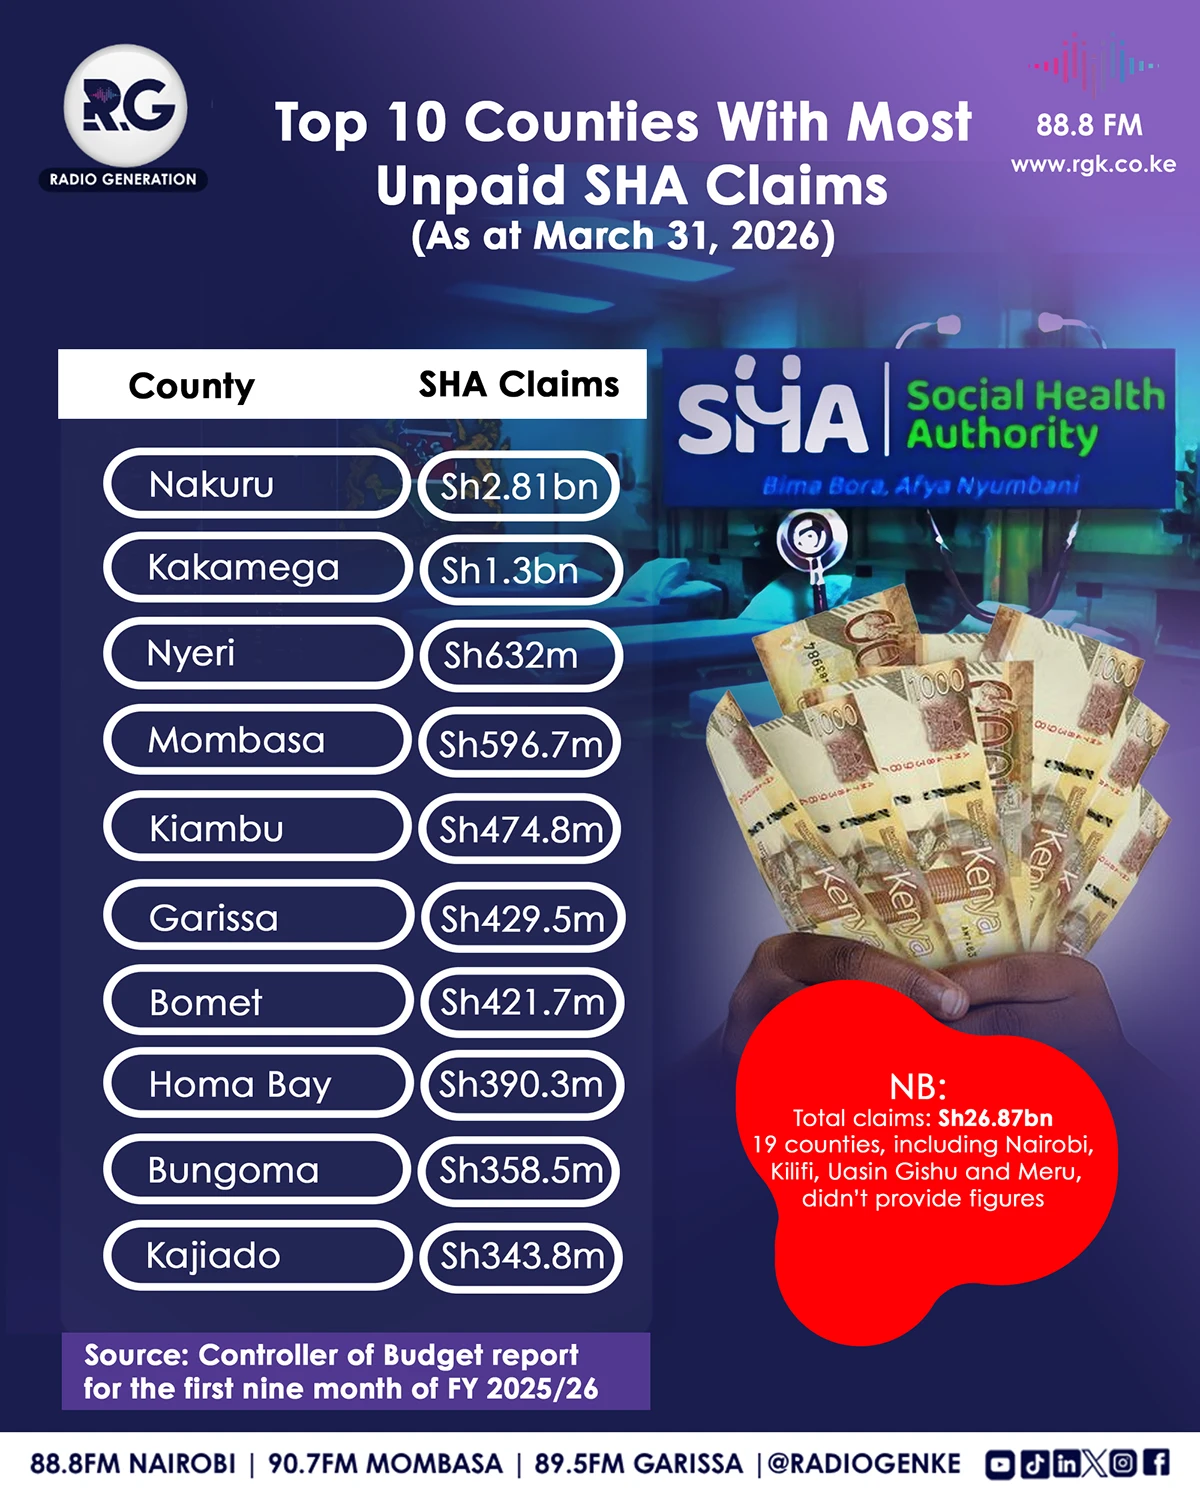
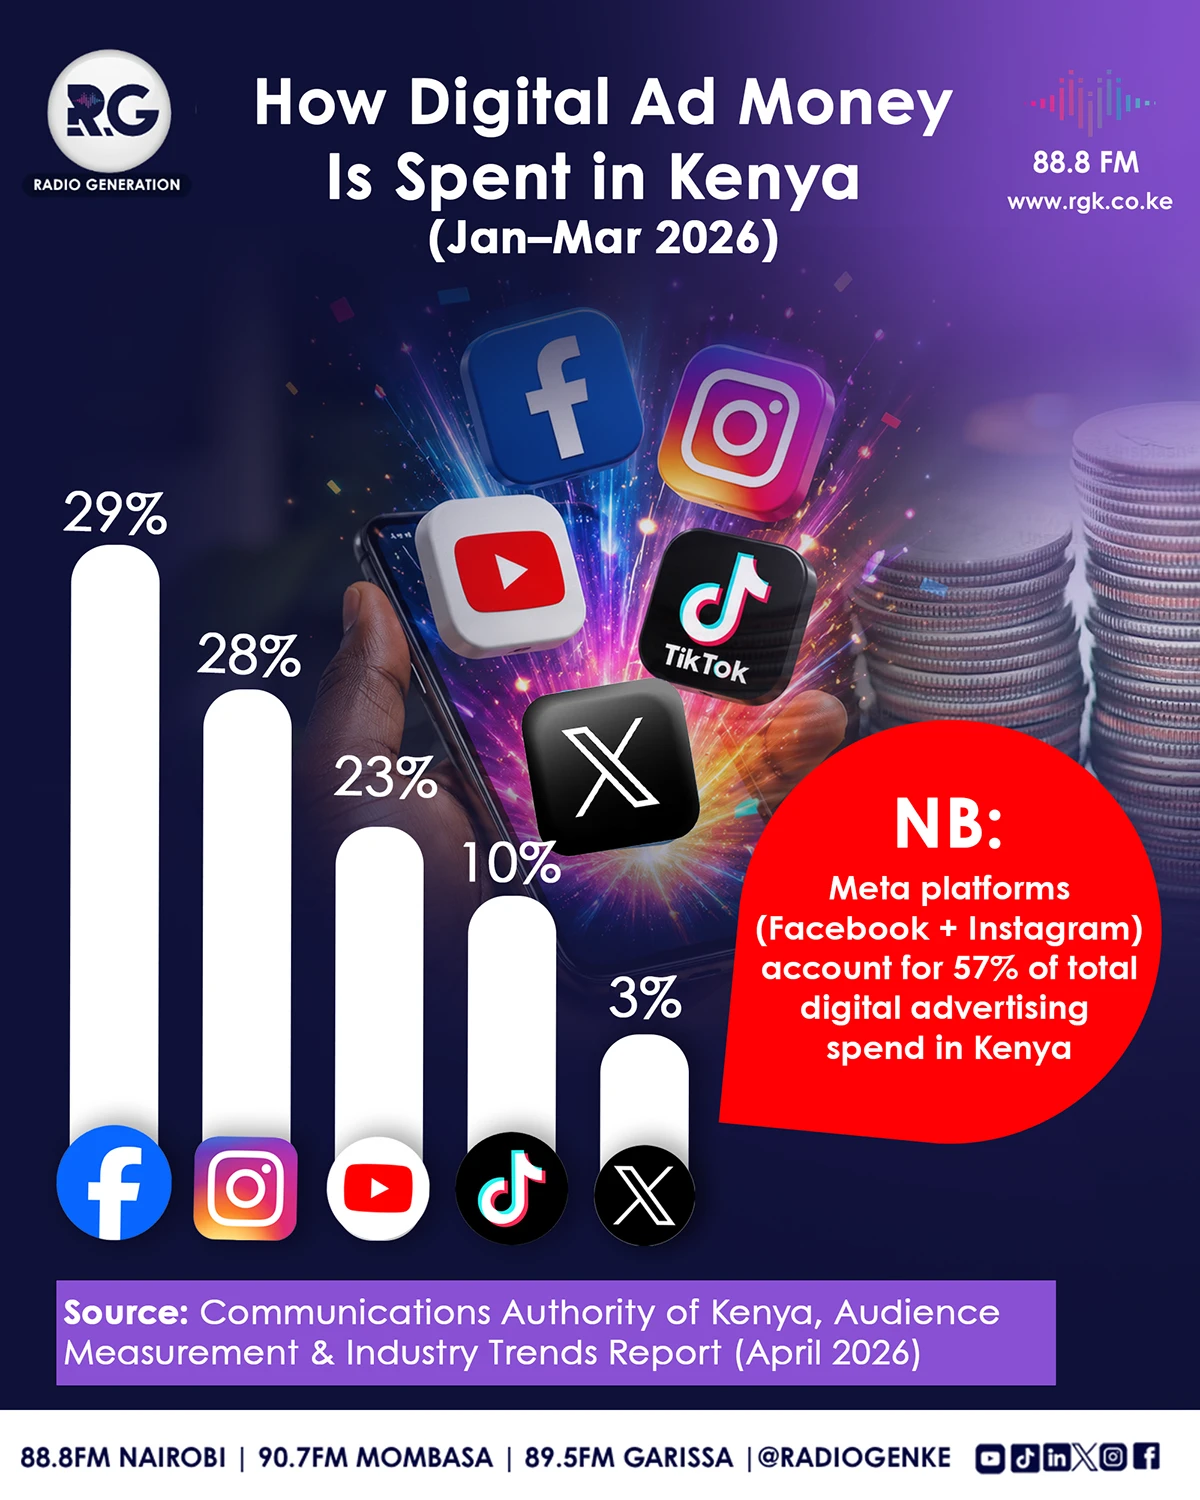
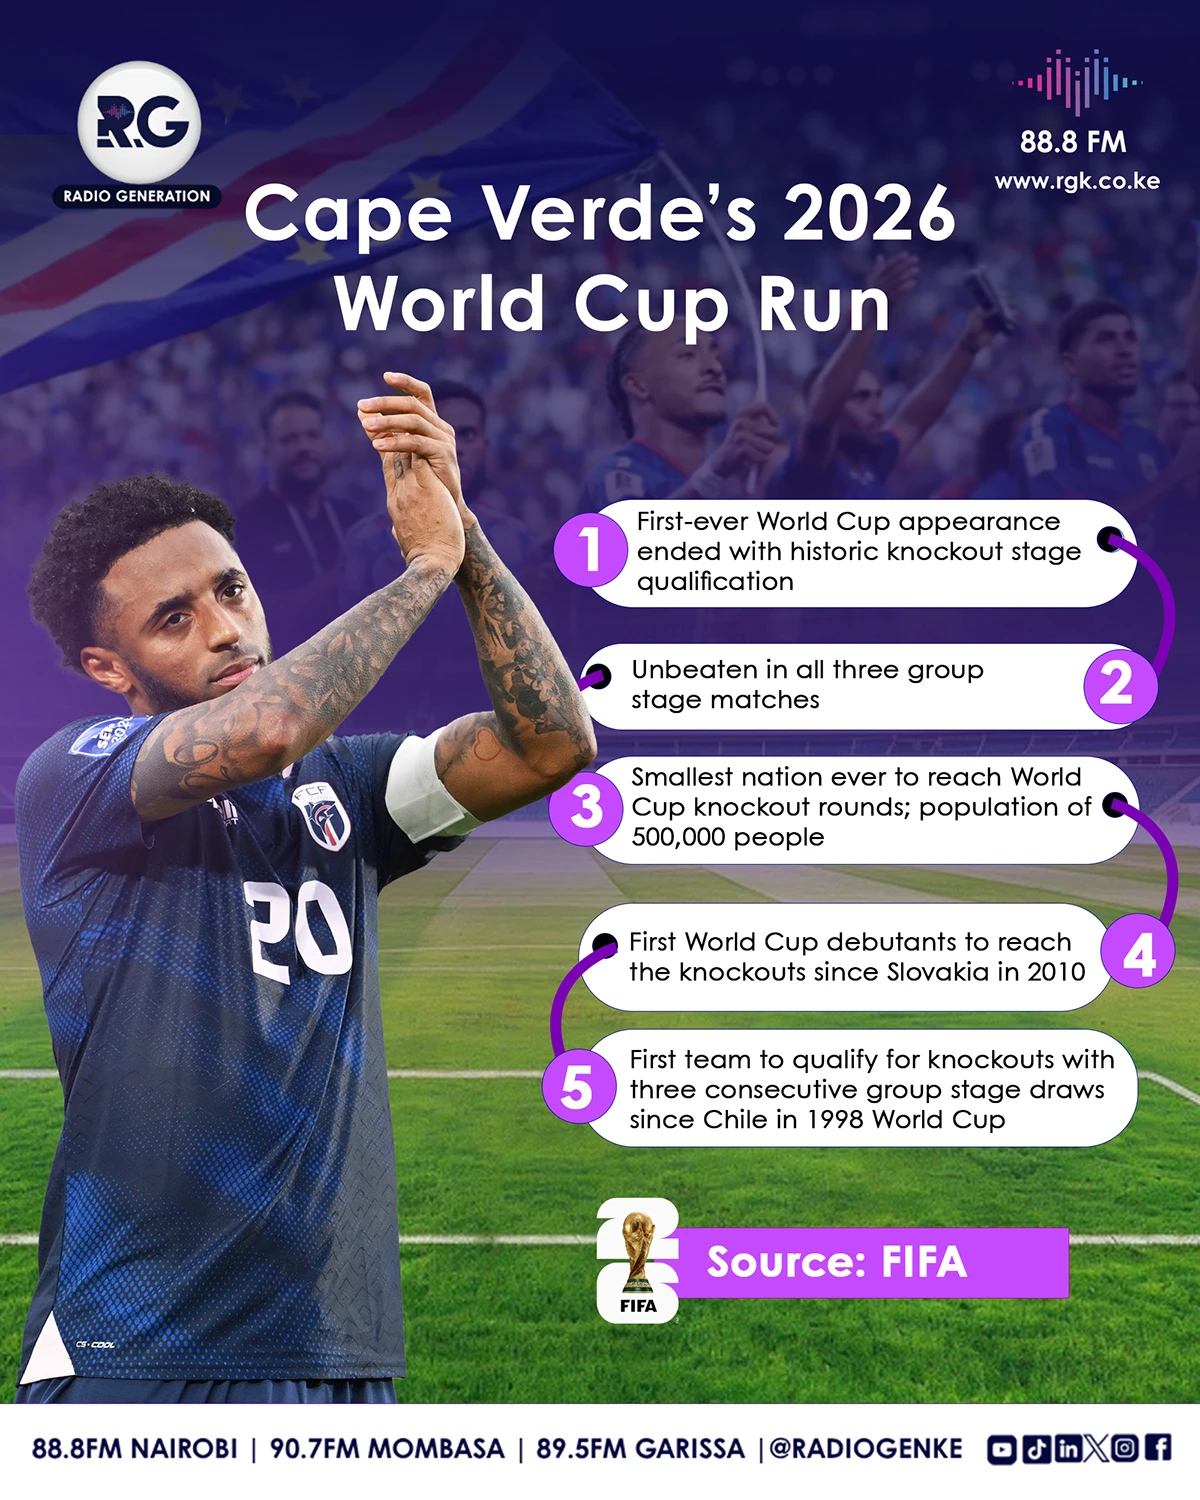
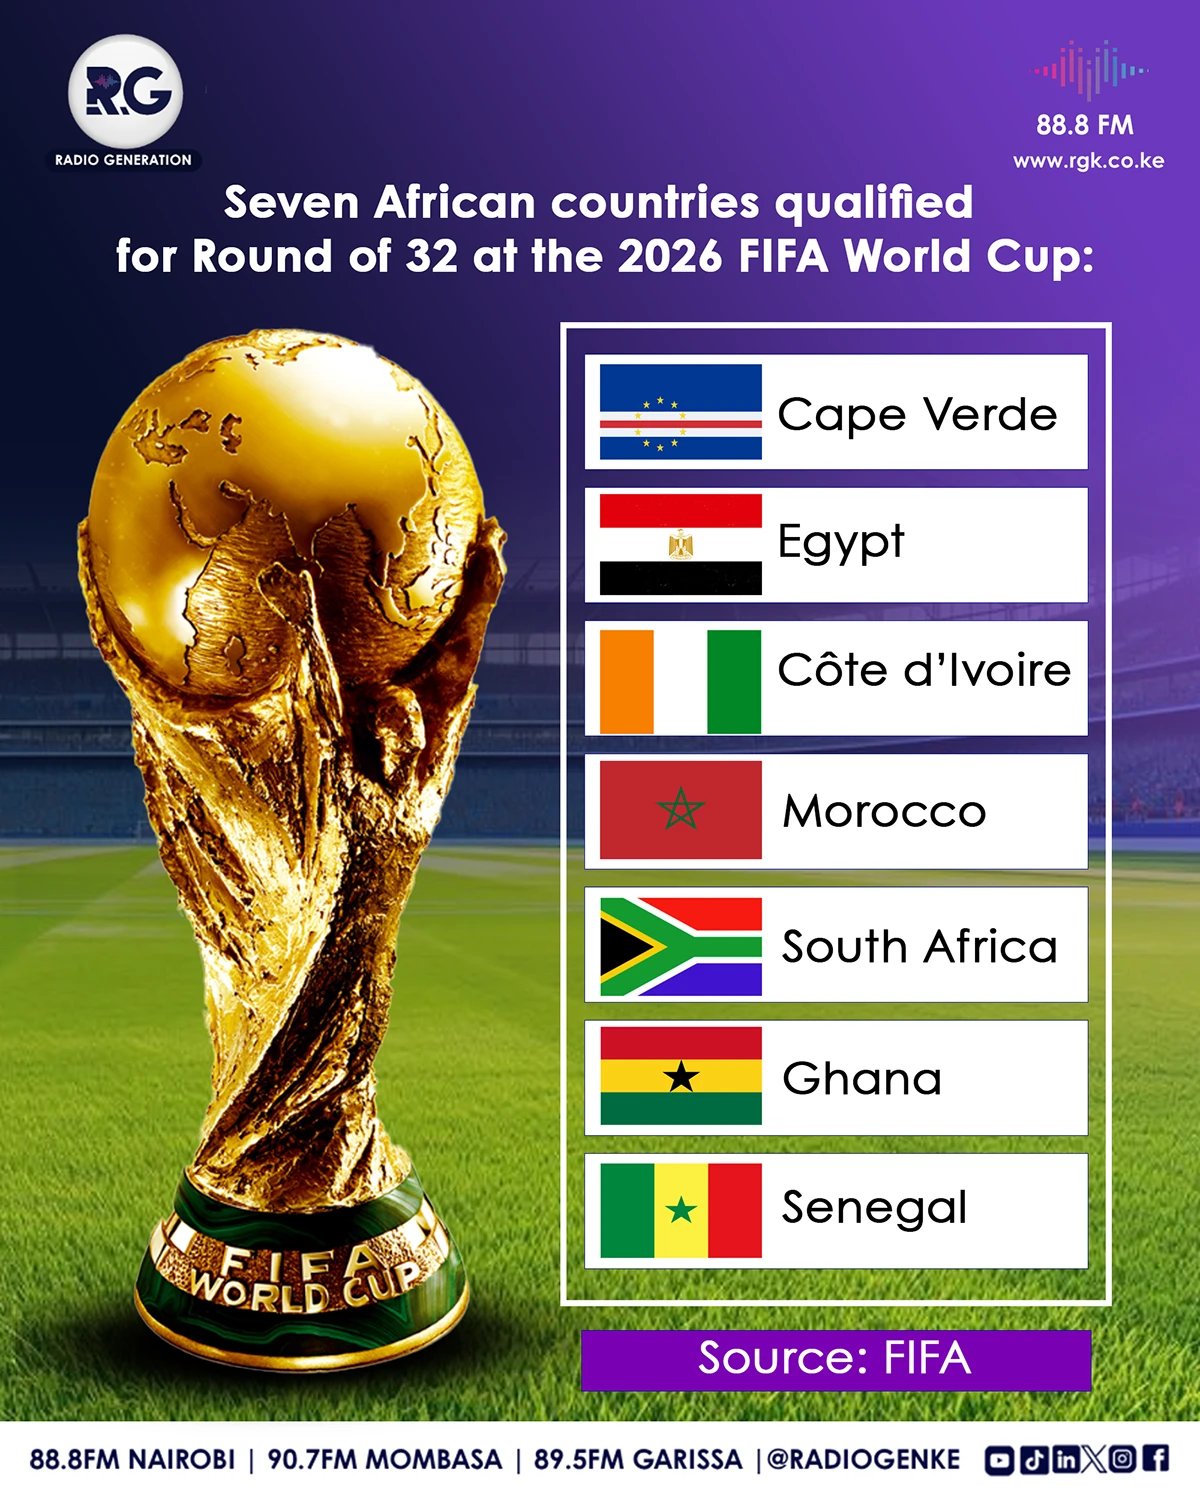
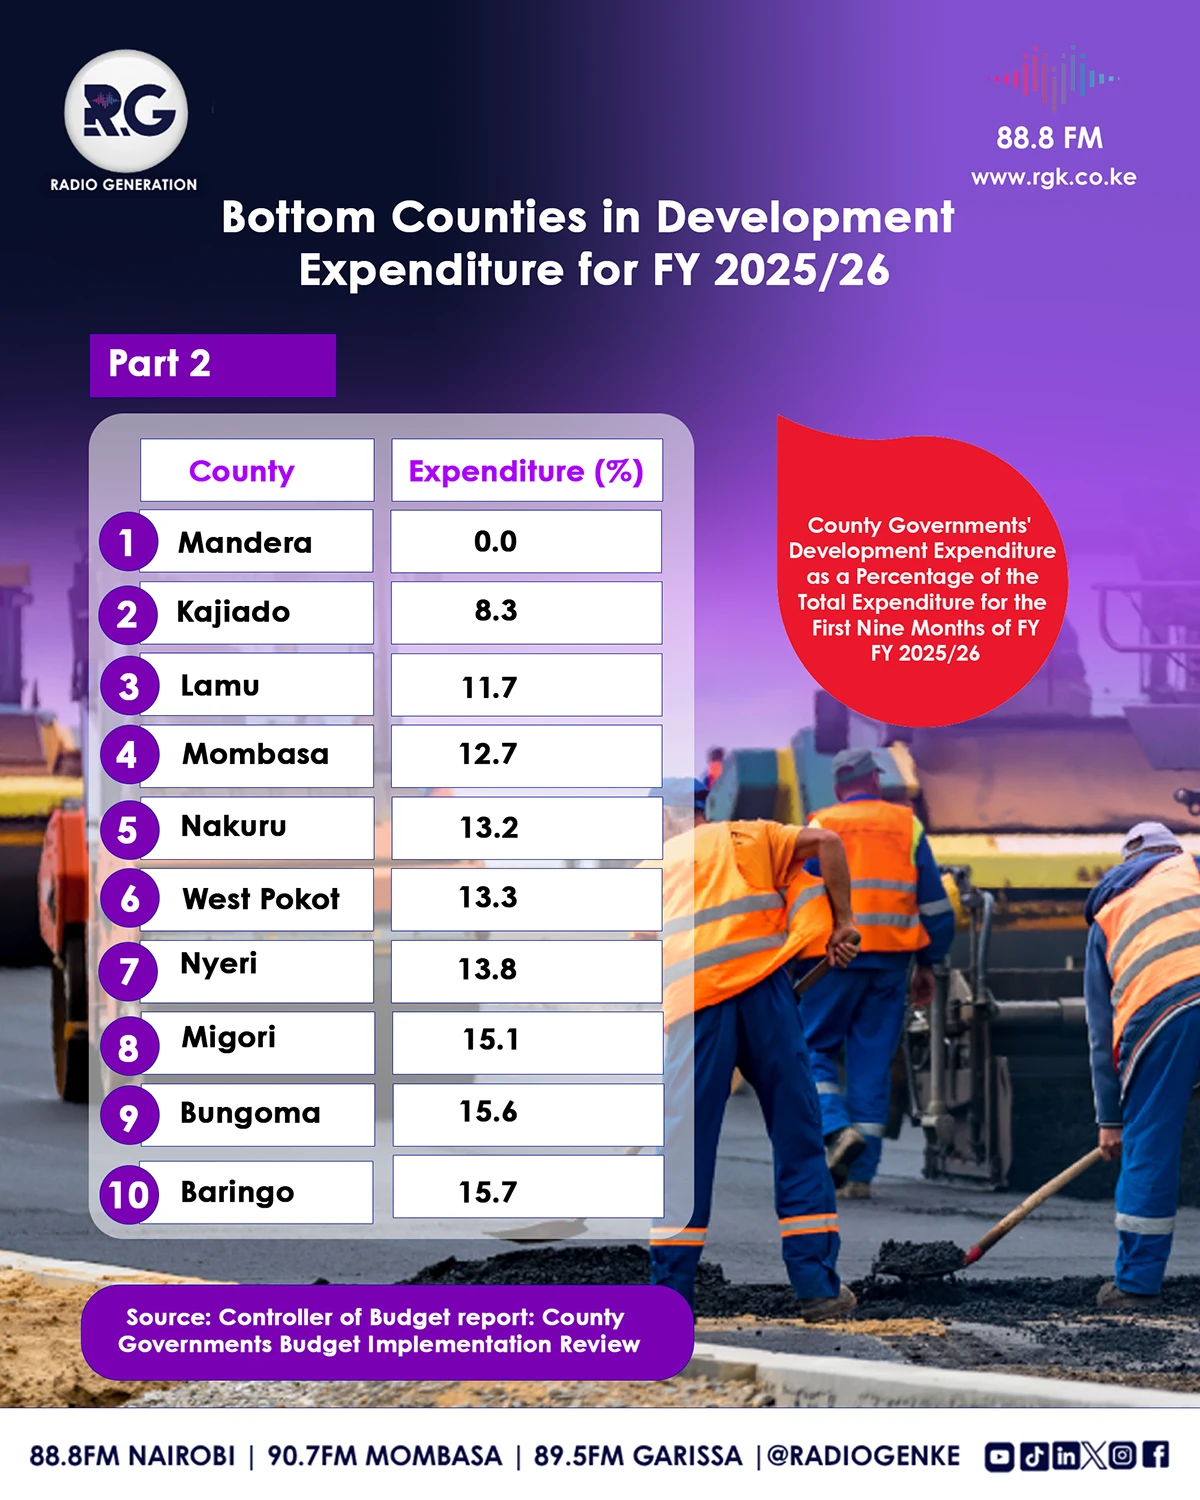
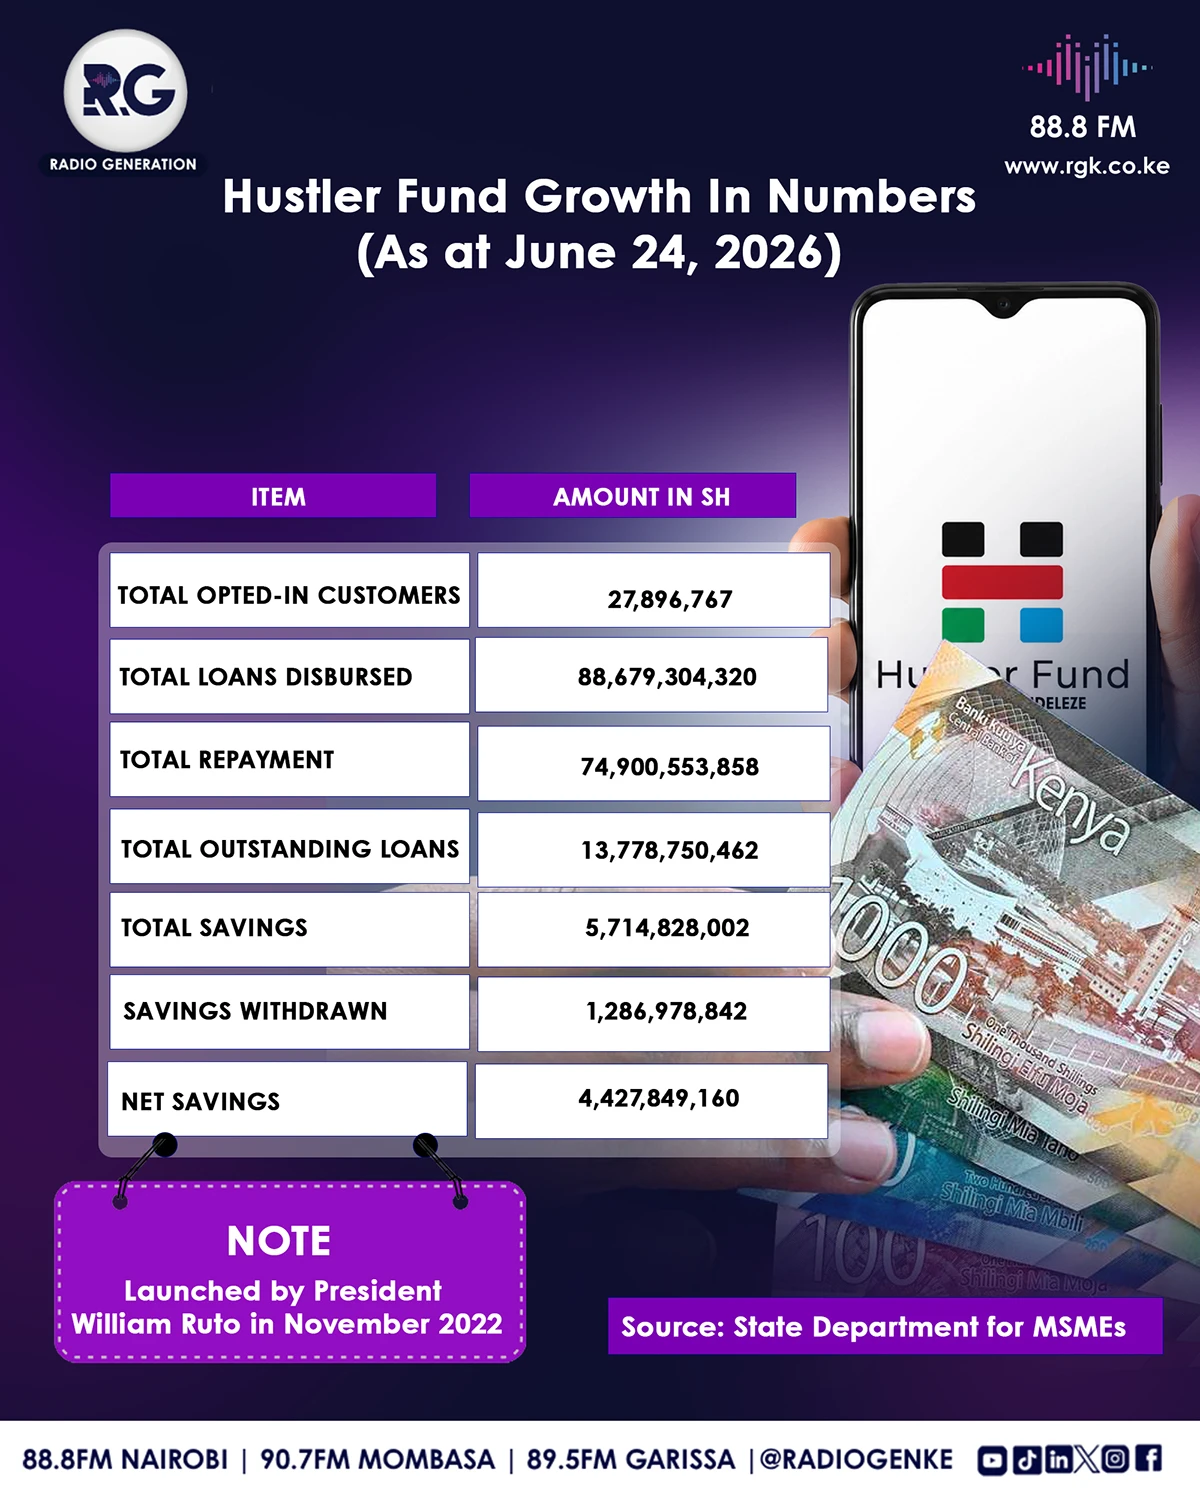
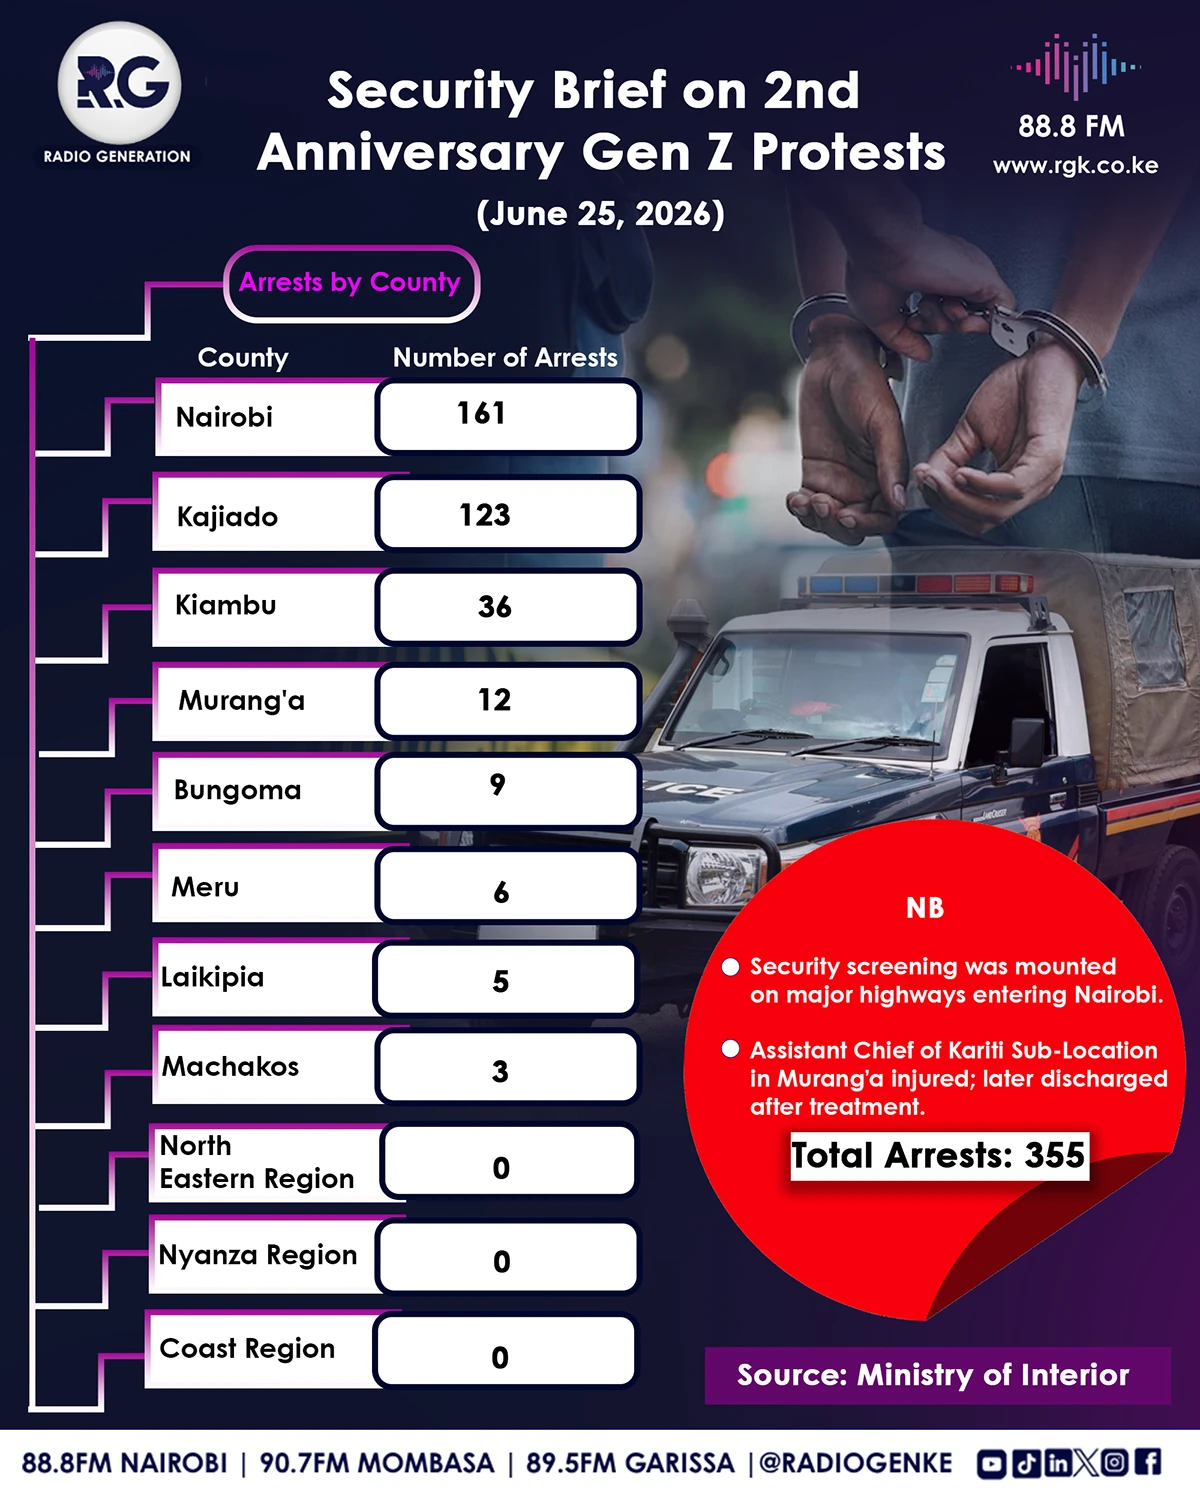
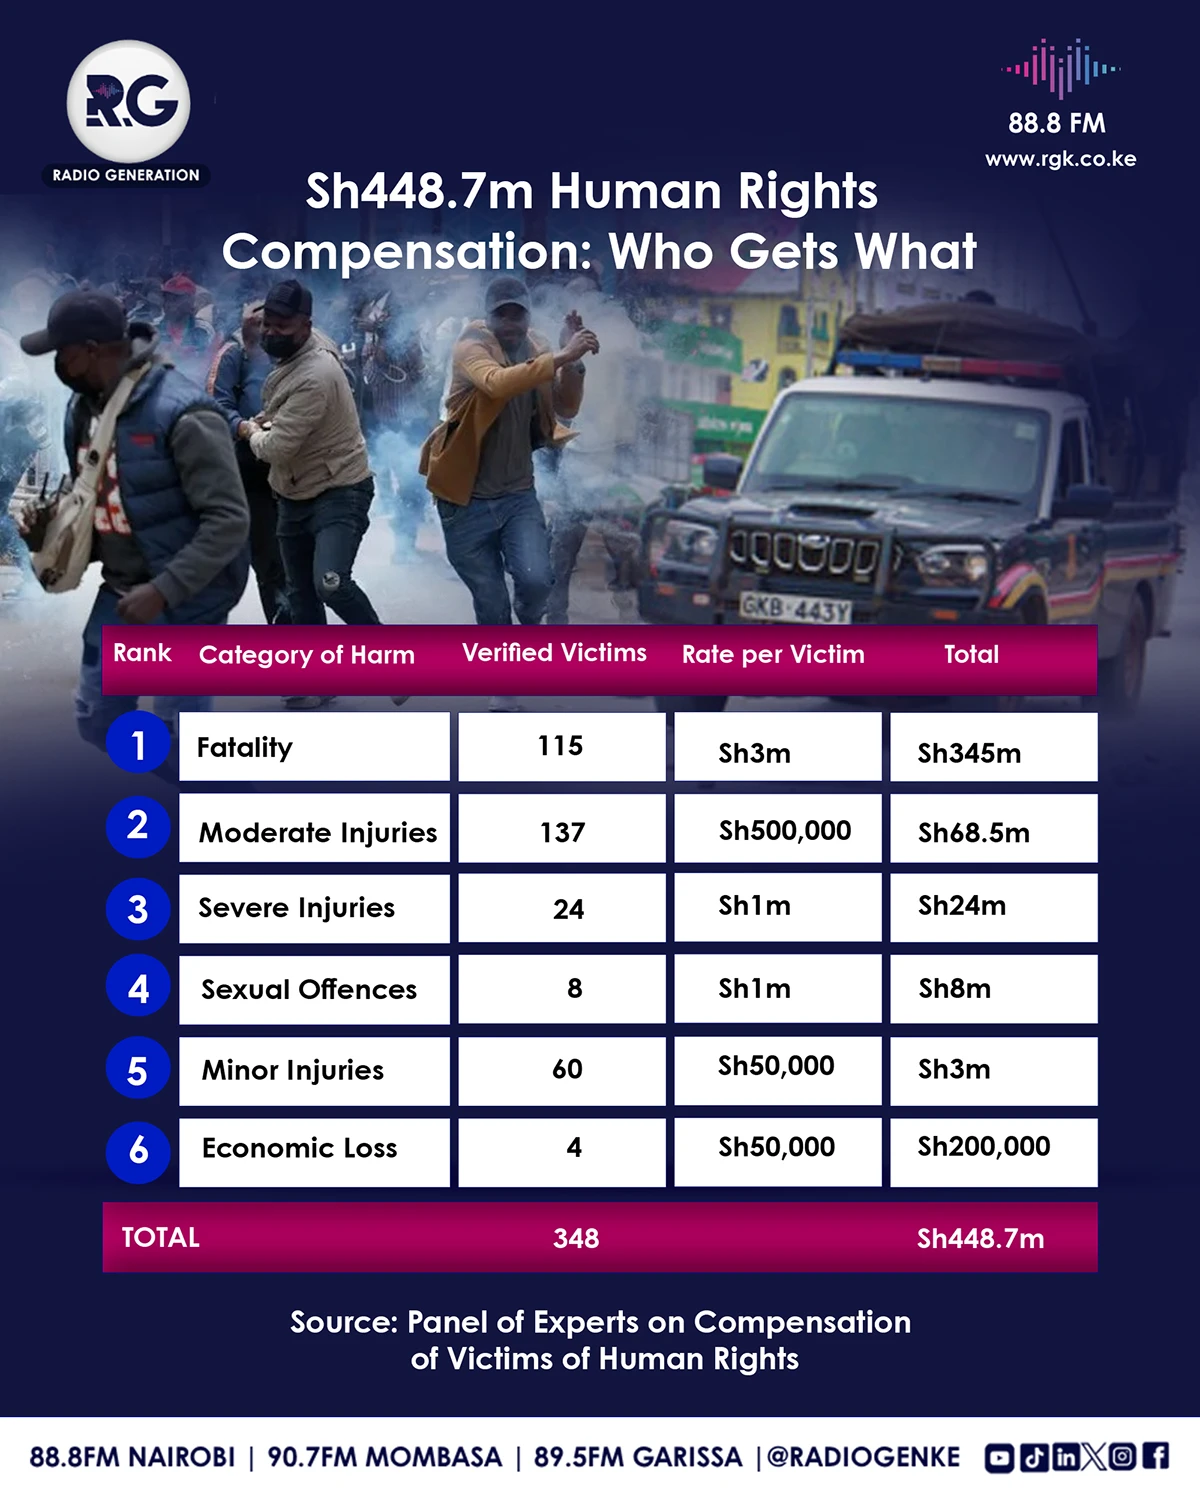
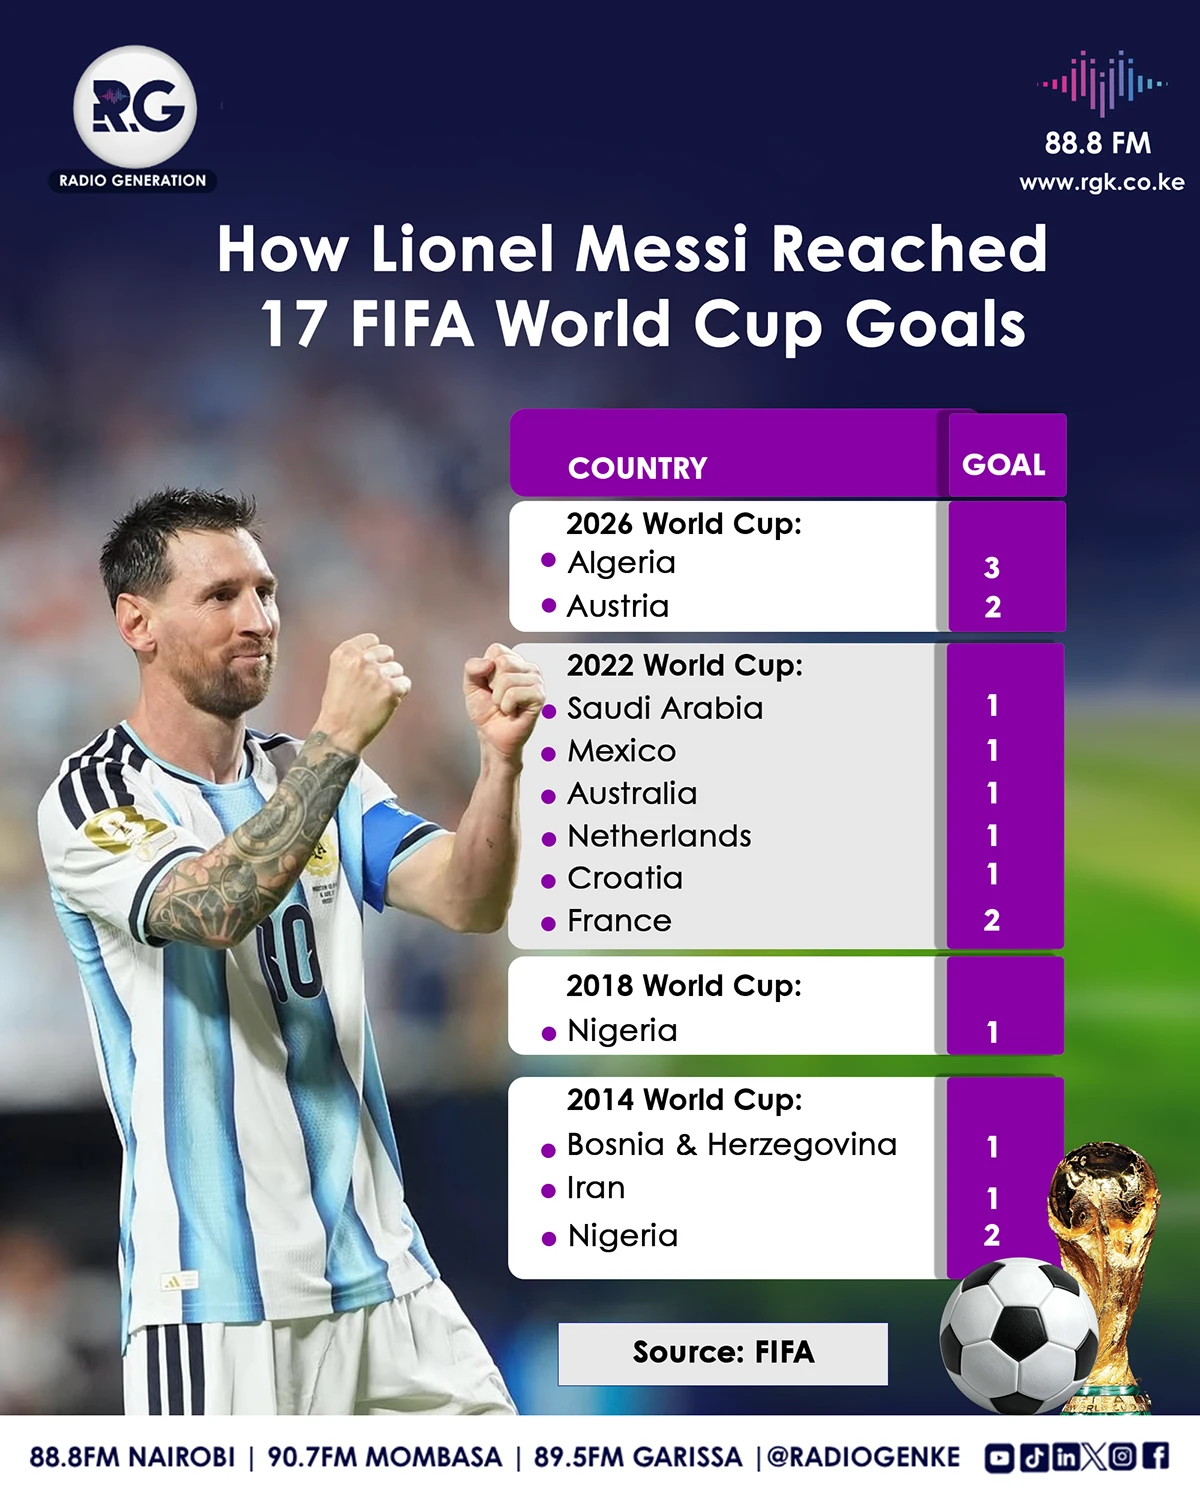
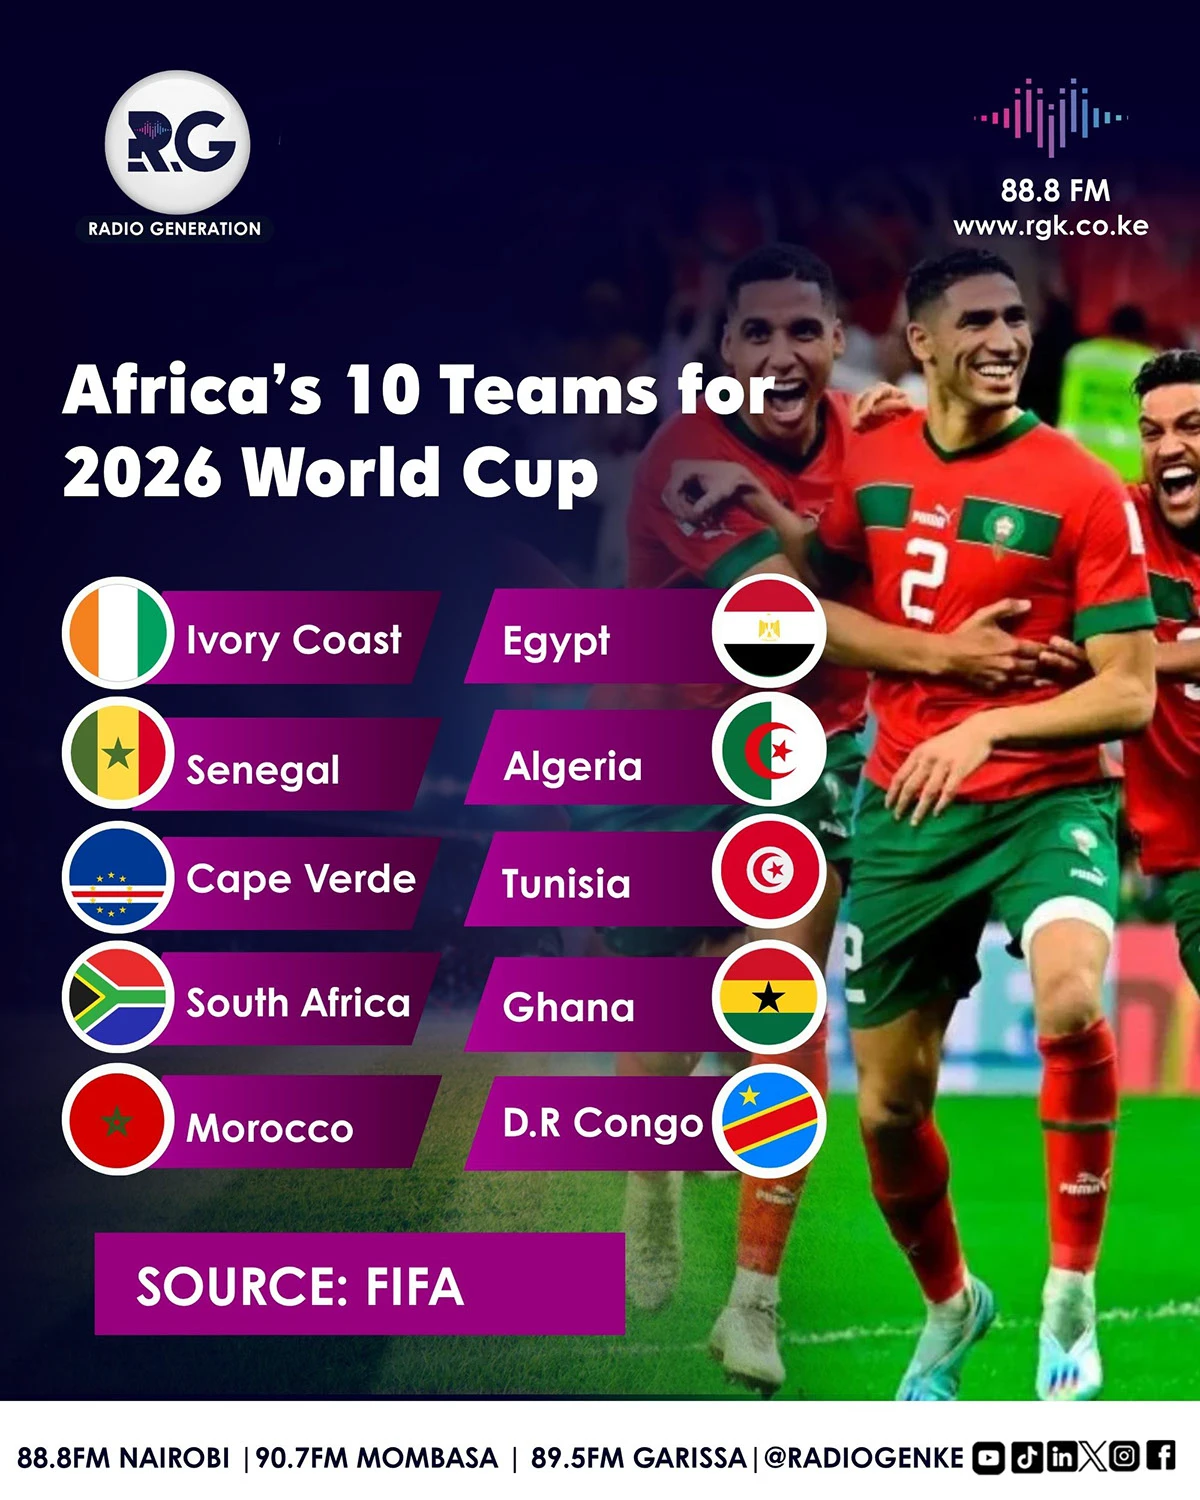
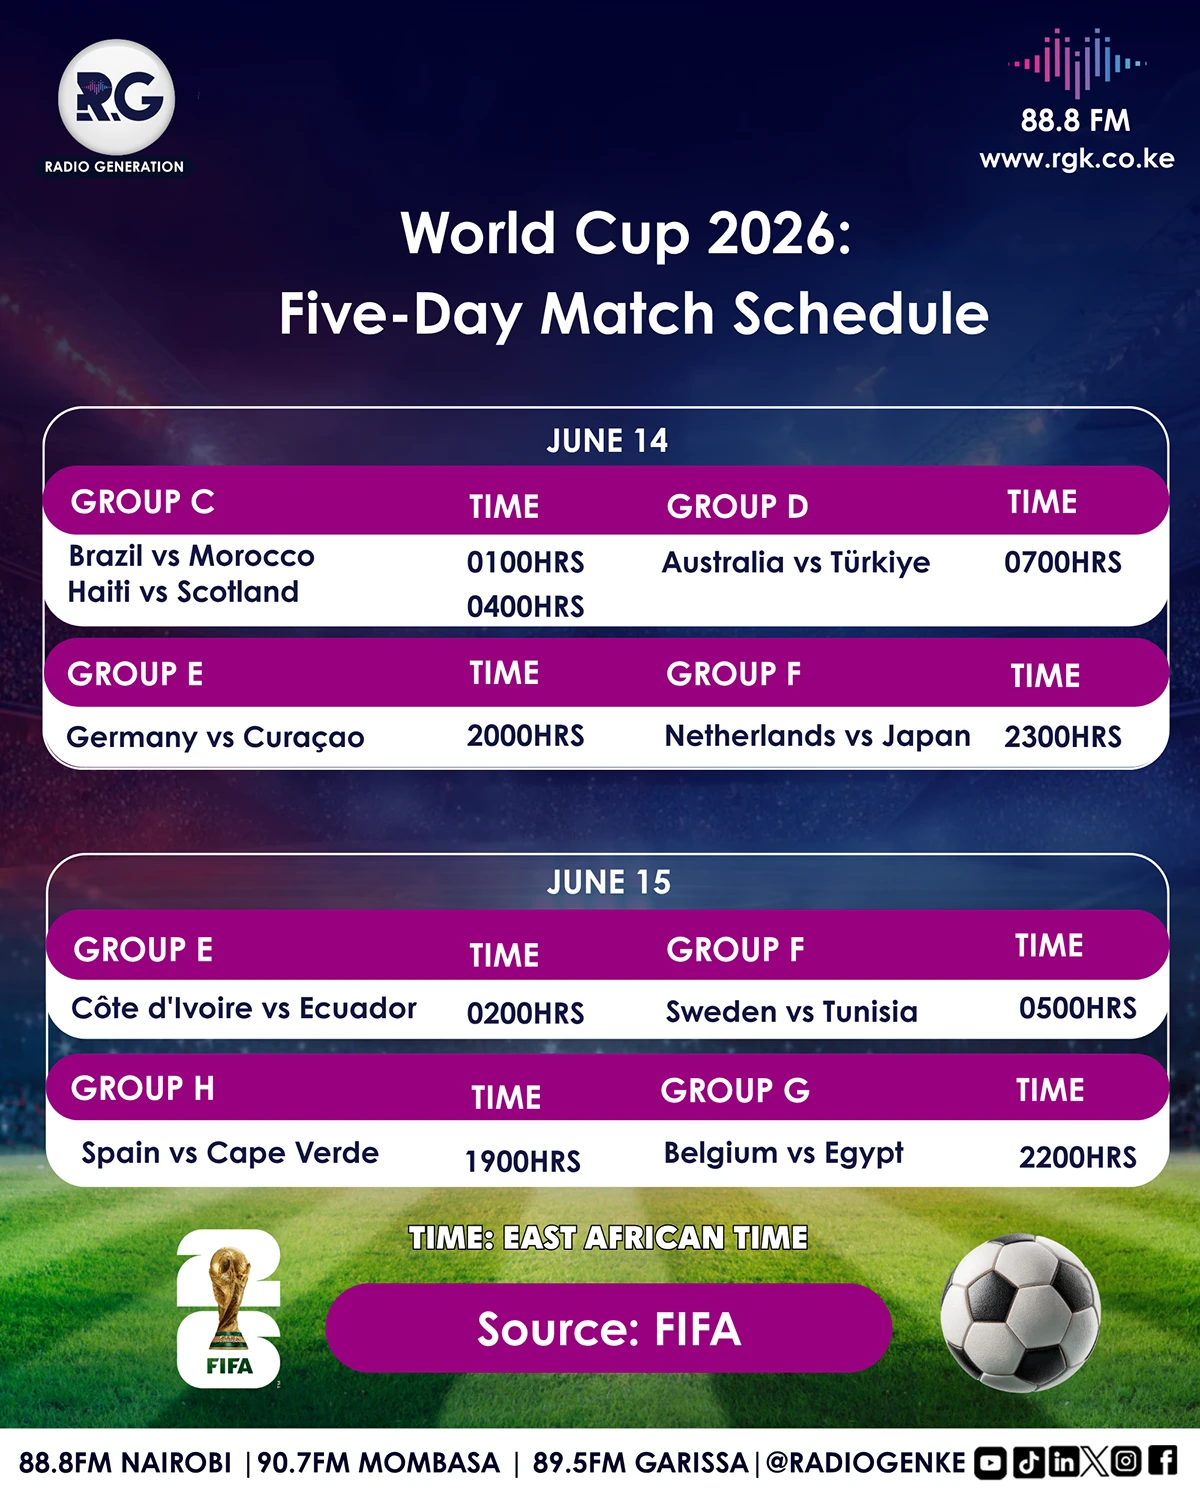
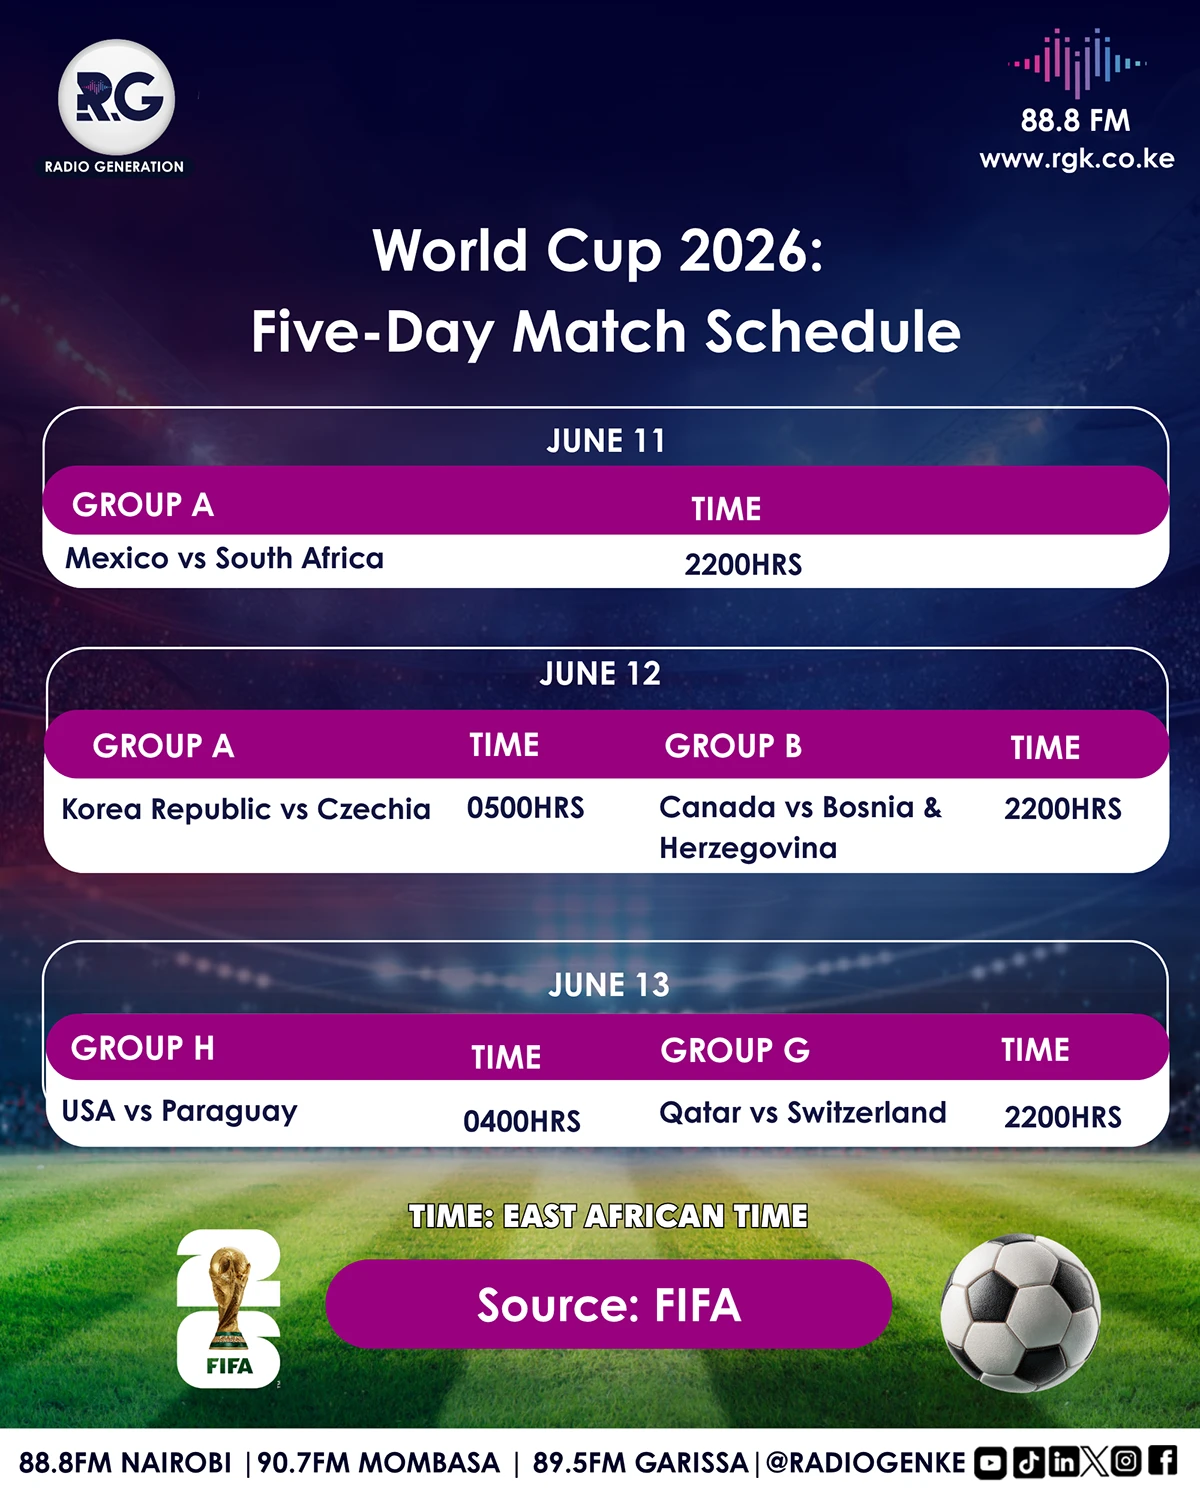
Data and process storytelling turned into clean, scannable visual systems — icons, flows and numbers that people actually finish reading.
- TOOLS
- Adobe Illustrator, Adobe Photoshop
- TYPOGRAPHY
- Geometric sans throughout with numeric emphasis at display scale
- PALETTE
- SOURCE
- View on Behance
Goals
- Turn dense information into a single-glance story
- Build an icon and colour system that scales
- Keep accuracy while cutting visual noise
Process
Content audit, information hierarchy sketching, then icon design in Illustrator and layout, spacing and colour balancing in Photoshop.
Results
- Complex topics reduced to one shareable frame
- A reusable icon and chart kit for future reports